POOL Corporation — Research Dashboard

FY2025 actuals + 1Q26 update  |  Sources: 2025 10-K, 1Q26 earnings call (Apr 23, 2026), 1Q26 investor presentation, POOL locator master, internal models

FY25 Net Sales
$5.29B
vs $5.31B FY24
Inventory (3/31/26)
~$1.7B
+14% YoY  |  +$200M from YE
Inventory Turns
2.7x
~135 days  |  vs 2.8x FY24
SKUs Offered
200,000+
~700 lines  |  ~40 categories
Sales Centers
455
3/31/26  |  +5 planned CY26
Customers
~125,000
no >10% customer

Product category mix — FY25 Disclosed

10-K p.8, p.39. Only Equipment / Chemicals / Building Materials meet the ≥10% disclosure threshold; everything else (parts & accessories, commercial, Horizon irrigation & landscape) sits in "Other / unallocated."

End-market mix — FY25 Disclosed

10-K p.5, restated p.14. The 64% maintenance baseload is the thesis cornerstone.

Cross-tab: product category × end-market discretionary cut Inferred

Cells are estimates calibrated to POOL's published marginals (column totals = 14/31/12/43, row totals = 64/22/14). Useful for orientation; not company-disclosed. Cell values are % of total FY25 net sales.

Non-discretionary Semi-discretionary (remodel/renovation + deferrable) Discretionary (new pool construction)

1Q26 YoY growth by product line

Chemicals volume-led; equipment was "a very pleasant surprise" (CFO); Horizon -2% reflects discretionary landscape weakness. CFO confirms GM rank: Building Materials > Chemicals > Equipment, so the +7% equipment print mechanically diluted the blended GM by ~20 bps. Europe shown as +16% USD per 1Q26 deck p.4 — the call commentary only references +5% local currency; the USD figure includes a meaningful FX tailwind.

Inventory balance trend

$1.7B at 3/31/26 driven by stocking for new locations, broader product range, mid-season vendor price increases, and opportunistic pre-season buys. Mgmt: "extremely healthy" profile concentrated in fast-movers.

Supplier concentration — % of FY25 COGS

Top 3 OEMs = ~43% of cost of goods sold. The single most concentrated exposure in the business and the structural rationale for POOL's private-label push (Regal, E-Z Clor, NPT, Xtreme Tab, bandless antimicrobial cartridge filter).

POOL360 — % of net sales, quarterly Q1 2024 → Q1 2026

Seasonal pattern: Q1 (lowest) → Q2/Q3 (peak season) → Q4 (lower again). Mgmt cites FY-average to remove seasonality. FY24 ≈ 12.5% → FY25 = 15% → FY26 target run-rate >15%. Q3 25 hit 17% peak. Long-term target >25% per Arvan ("couldn't ultimately exceed 25% target and maybe higher").
Sources: Q1 24 = 11% (Q1 25 call p.4 comparison); Q2 24 = 14.5% (Q2 25 p.4); Q4 24 = 12.5% (Q4 25 p.3); Q1 25 = 12.5% (Q1 26 p.5); Q2 25 = 17% (Q2 25 p.4); Q3 25 = 17% all-time-high quarter (Q3 25 p.3); Q4 25 = 13.5% (Q4 25 p.3); Q1 26 = 13% (Q1 26 p.5). Q3 24 estimated ~13% (between adjacent data points; not directly disclosed in any retrieved call).

FY25 dollar matrix — product × discretionary ($M)

Non-disc.Semi-disc.Disc.Total
Chemicals$688$53<$25$740
Equipment$900$475$265$1,640
Building materials$53$370$212$635
Other / unallocated$1,745$265$265$2,274
Total$3,385$1,164$740$5,289

Row totals match POOL's disclosed product mix; column totals match the 64/22/14 end-market split. Cells are inferred from qualitative disclosures (Arvan pump/filter vs heater/light comment, building-materials use cases).

Inventory accounting & metrics

Costing methodMoving-average cost (not LIFO/FIFO)
Inventory @ 12/31/25$1,454.7M
Inventory @ 12/31/24$1,289.3M
YoY growth+13%
Inventory @ 3/31/26~$1,700M
Build from YE+$200M
Turns (trailing 4Q)2.7x
Implied days inventory~135 days
Obsolescence reserve$23.9M (~1.6% of gross)
2025 write-down provision$4.0M
2025 write-offs$(6.7)M
±20% reserve sensitivity±$4.8M pretax, ±$0.10 EPS

Granular sub-segmentation Modeled from internal frameworks

POOL discloses only the 4-category top-level mix. Sub-products below are decomposed using three internal models already in this KB: (1) Tier T1–T5 renovation-event framework [POOL_RevenueDrivers_Model.xlsx > Age_Cycle], (2) manufacturer pull-through [Pool_Distributors_Data.xlsx > Mfr_PullThrough], (3) LTV-per-pool decomposition [POOL_RevenueDrivers_Model.xlsx > LTV_Per_Pool]. Sub-category $ are calibrated so each row sums to the disclosed top-level total.

Tier T1–T5 industry event mix & POOL share

T1 (single equipment swap, 9-yr cycle) is the largest pool of revenue at $2.25B industry / $1.4B POOL. T4 major modernization is the highest-$/event at $18k. POOL captures ~62% of T1 (equipment-led) but only ~50% of T2–T5 (building materials face Heritage NPT + regional masonry).

Replacement cycle by component (years to swap)

Cleaner: 5 yr (fastest). Variable-speed pumps may stretch 30–50% past spec per Arvan. The 2010–2015 VS pump cohort is now hitting replacement — second wave from 2020–2022 COVID cohort hits 2028–2031.

Equipment Lifecycle Tracker — the two industry-defining transitions

New equipment that extends the replacement cycle is the most under-appreciated structural lever on POOL's T1 service revenue. Variable-speed pumps (replacing single-speed, 2010→present) and LED lights (replacing incandescent, 2008→present) both stretched useful life by 30–80% and deferred billions of $ of replacement demand. Both are now reversing — first-wave installs from 2010–2015 are hitting end-of-life.

⚙ Variable-speed pumps vs single-speed

Single-speed (legacy)Variable-speed (current)
Spec replacement cycle7–10 yr (avg 8)10–15 yr (avg 12)
Actual stretched life8–10 yr12–18 yr (Arvan: "30%, 40%, 50%" past spec)
Wholesale unit cost$300–500$700–1,100
Annual energy cost$800–1,500$250–500
Regulatory inflectionDOE July 2021 mandate >1 THP
Installed base today~55%~45% (and growing)
Next wavelate SS cohort EOL2026–2030 (first VS wave)

The cycle extension cost POOL ~$100M/yr of pump revenue during the transition. First-wave VS pumps (2010–2015) now reaching 11–16 yr in service → replacement starts now.

💡 LED vs incandescent lighting

Incandescent (legacy)LED (current)
Fixture cycle10–15 yr8–12 yr (entire fixture)
Bulb cycle1–2 yr (constant)none (sealed)
Wholesale fixture cost$80–150$200–400
Wholesale bulb cost$25–60 eachn/a
10-yr TCO~$400 (fixture + 5–8 bulbs)~$300 (fixture only)
Installed base today~65%~35%
Next waveincandescent EOL conversions2025–2030 (first LED wave + conversions)

The bulb-replacement category was a $40–60M/yr POOL line that collapsed to <$5M as LED took over. Fixture revenue is bigger per event but 30% less frequent. Net upcycle ahead from the conversion-of-legacy + first-LED-wave double.

Adoption curve — VS pumps & LED lights (% of new installs by year)

Pumps: gradual 2010–2020, mandate 2021. Lighting: faster S-curve 2010–2020. Note: % of new installs, not % of installed base. Installed-base mix lags by ~7–10 years due to slow turnover.

Installed-base mix today by component (legacy vs current tech)

Pumps still 55% single-speed → 45% VS conversion runway. Lighting 65% incandescent → big LED conversion opportunity in remodels. Salt systems 40% penetrated. Heat pumps only 15% — long runway.

Full equipment tracker — cycle, installed-base age, replacement wave timing Modeled

Installed-base age modeled from POOL_RevenueDrivers_Model.xlsx > Age_Cycle: each pool of age A with cycle C has been replaced floor(A/C) times; current unit age = A mod C, weighted by cohort size.

Component Legacy tech Current tech Legacy cycle Current cycle Δ cycle Installed base mix Avg age in service Next wave $ direction
PumpSingle-speedVariable-speed8 yr12 yr+50%55% SS / 45% VS~7–9 yr2026–2030
LightingIncandescentLED12 yr fixture + 1.5 yr bulb10 yr fixture+20% fixture / kills bulb cycle65% incand / 35% LED~10–12 yr2025–2030
Heater (gas)Atmospheric millivoltElectronic ignition8–10 yr10–12 yr+20%85% current / 15% legacy~7 yr~10%/yr
Heater (heat pump)n/aHigh-efficiency HPn/a12–15 yrn/a85% gas / 15% HPvariesgas→HP swap
Filter (sand)StandardHigh-rate15–20 yr15–20 yrflat70% current / 30% old~10 yr~5%/yr
Filter (cartridge)50–200 sq ftBandless antimicrobial10–12 yr12–15 yr+20%95% std / 5% new~6 yr~7%/yr⬆ slight
Filter (DE)StandardStandard15–20 yr15–20 yrflat95% legacy~10 yr~5%/yr
Salt chlorinator (system)n/a (chlorine tabs)Salt cell + controln/a7–10 yrn/a60% tabs / 40% salt~6 yr~12%/yr salt base
Salt cell (consumable)n/aReplaceable celln/a3–7 yrn/a(consumable)n/acontinuous⬆ recurring
AutomationMechanical timeclockSmart system15–20 yr10–12 yr−30% (faster!)50% timeclock / 50% smart~8 yr2024–2030
Cleaner (suction)StandardStandard5–8 yr5–8 yrflat95% legacy~3 yr~15%/yr
Cleaner (pressure)StandardStandard6–10 yr6–10 yrflatdeclining~5 yr~12%/yr
Cleaner (robotic)n/aRoboticn/a5–8 yrn/a30% robotic / 70% suction/pressure~4 yrcontinuous, premium
Interior — plasterWhite plasterWhite plaster10–15 yr10–15 yrflat~50% of new~10–14 yr~7%/yr
Interior — pebblen/aPebble Tec / StoneScapesn/a15–25 yr+50–80% vs plaster~50% of new~10 yrspread later⬇ slower events
Interior — quartzn/aQuartz aggregaten/a12–18 yr+20% vs plastersmall / growing<8 yrspread later
Vinyl linerStandard vinylHeavyweight virgin7–10 yr8–12 yr+20%~5% of inground~6 yr~12%/yr
Pool cover (manual)TarpMesh safety cover5–8 yr8–12 yr+50%60% mesh / 40% legacy~5 yr~12%/yr
Pool cover (auto)n/aTrack + motorn/a15–20 yr / 5–7 yr fabricn/a<5%variescontinuous fabric⬆ slight
UV / ozone sanitizern/aSupplemental UV/O3n/a3–5 yr bulb / 10–15 yr unitn/a~95% chlorine onlyn/aadopting base⬆ new category

Where we are in the cycle — quick glance

Pumps
First VS wave starting + SS late-cohort EOL
⬆ Rising
Lighting
Incandescent EOL + first LED wave
⬆ Rising
Automation
First smart-system wave; faster cycle
⬆ Rising
Salt systems
Adoption growth + cell consumable
⬆ Rising
Heat pumps
Adoption growth (new category)
⬆ Rising
Robotic cleaners
High-velocity share-take
⬆ Rising
Gas heaters
Mid-cycle steady-state
→ Flat
Sand/DE filters
Mid-cycle steady-state
→ Flat
Plaster finish
Steady-state, share loss to pebble
→ Flat
Pebble finish
Longer cycle defers events
⬇ Slower events

The convergence argument: 5 of 6 major equipment categories are entering simultaneous replacement waves (VS pumps + LEDs + smart automation + salt cells + robotic cleaners). Layered on the 314k COVID-cohort pool installations from 2020–2022 that hit 7–10yr equipment service starting 2027–2030, the equipment line should accelerate beyond mgmt's current "flat-to-modest" guidance even with new construction stuck near 60k starts/yr.

Equipment ($1,640M) — sub-category split

Pumps lead at ~28% ($460M). Top suppliers per category: Pumps (Pentair IntelliFlo, Hayward TriStar) · Heaters (Pentair MasterTemp, Raypak) · Automation (Pentair IntelliCenter, Hayward OmniLogic) · Cleaners/Robotics (Maytronics Dolphin).

Chemicals ($740M) — sub-category split

Sanitizers (trichlor, cal-hypo) = 50% / ~$370M. Private-label (Regal, E-Z Clor) penetration estimated 30% of chemical $, materially higher than equipment private-label.

Building Materials ($635M) — sub-category split

Interior finish (plaster, pebble, StoneScapes) is 40% / ~$255M. NPT-branded share estimated 60-70% of interior finish, 50% of BM overall. NPT rebrand Nov 2025: "National Pool Tile" → "National Pool Trends."

Other / unallocated ($2,274M) — what's in the 43%

Parts & accessories at $910M is the biggest single chunk and has ~100k+ SKUs alone. Horizon irrigation/landscape (~$680M, 92 of 476 locations) is the largest non-pool segment buried in "other."

SKU count distribution — the 80/20

Parts & accessories = 110k SKUs (55% of catalog) but only 17% of sales. Equipment = 12k SKUs (6%) but 31% of sales. Top ~30k SKUs drive ~75% of revenue. This is the structural rationale for POOL360 — automate the tail.

Modeled inventory $ by category vs sales mix

Equipment is 31% of sales but ~38% of inventory $ (slowest-turning category). Chemicals = 14% of sales but only ~7% of inventory $ (fastest turn at 5.0x). The +$200M Q1 inventory build is concentrated in equipment positioning for the season.

Full cross-tab — granular product × discretionary × inventory ($M, FY25) Modeled

Sub-category Non-disc. Semi-disc. Disc. Total sales Inv. $ Turns DIO
EQUIPMENT$900$475$265$1,640$5552.0x183d
  Pumps$320$95$45$460$1652.0x183d
  Heaters$165$145$50$360$1302.0x183d
  Filters$160$50$20$230$802.0x183d
  Automation / lighting / cleaners / salt$255$185$150$590$1802.0x183d
CHEMICALS$688$42$10$740$1005.0x73d
  Sanitizers + Balancers + Algaecides$580$12$0$592$805.0x73d
  Specialty + Salt$108$30$10$148$205.0x73d
BUILDING MATERIALS$53$370$212$635$2002.2x166d
  Interior finish (plaster/pebble)$0$165$90$255$802.2x166d
  Tile / coping / deck / misc$53$205$122$380$1202.2x166d
OTHER / UNALLOCATED$1,744$277$253$2,274$6002.7x135d
  Parts & accessories$720$130$60$910$2603.8x96d
  Horizon irrigation & landscape$530$80$70$680$1902.5x146d
  Commercial pool products$200$30$20$250$901.8x203d
  Non-equip cleaners + NPT hardscapes + other$294$37$103$434$603.0x122d
TOTAL$3,385$1,164$740$5,289$1,4552.7x135d

Granularity ceiling — what's not obtainable through public sources

Granularity desiredWhy blockedPossible path
Actual SKU-level inventory $POOL Note 12: "impracticable"Dealer credentials on POOL360 (ToS concerns)
Purchase-order frequency & $Entirely privateChannel-check via former POOL employees on AlphaSense
Brand-level rev within equipment (Pentair/Hayward/Jandy split)Not disclosed at POOL levelTriangulate from supplier 10-Ks (already in Mfr_PullThrough tab)
Private-label $Mentioned narratively onlyInvestor Day push (May 12, 2026)
Inventory by sales centerNever disclosedNot scalable
Customs/import data (Chinese trichlor, Pentair Mexico)Available via Panjiva / ImportGeniusSubscription paywall
Real-time POOL360 inventory levelsDealer-portal-onlyNot pursuable through public means

Management quotes now live in their own tab —

476 locations worldwide  |  424 US · 17 CA · 10 FR · 10 AU · 5 MX · 10 other
Banners: SCP (269)   Horizon (92)   Superior (77)   NPT (19)   Pool Systems AU (10)   Jet Line (9)

Interactive map (folium). Source: Unison_KB/dashboards/pool_locations/locations.csv built from poolcorp.com/map_api/map.php May 2026 pull. Reconciliation: 10-K reports 456 sales centers at 12/31/25 (which INCLUDES the 19 NPT dedicated sales centers — per 10-K p.4); locator shows 476 entries worldwide. Gap of ~20 is a mix of international franchisee-affiliated, very-recently-opened, or in-transit entries. Mgmt's quarterly KPI is the 455 figure (one consolidation reduced 456→455 in Q1 26).


🌱 Horizon vs 💧 POOL (SCP+Superior) — 5-year Sand State expansion (FY20 → FY25)

Over the past 5 years, Horizon (irrigation/landscape) grew 76 → 88 US (+12 / +16%) while the core pool banners (SCP + Superior combined) grew 259 → 299 (+40 / +15%). In the four Sand States, the pool banners added +16 net locations vs Horizon's +11 — roughly a 2:1 ratio favoring pool wholesale over irrigation in the same geography. TX is the standout SCP story (+6) while TX Horizon peaked at 22 in FY23 and rationalized back to 18 (-4 from peak) — opposite patterns in the same state. FY24-25 is the Horizon rationalization phase (-4 from peak) while SCP+Superior is still adding (+11 over those two years).

FY25 POOL Sand States
157
FY20 141 · +16 / +11%
FY25 Horizon Sand States
66
FY20 55 · +11 / +20%
Combined POOL Sand-State footprint
223
FY20 196 · +27 / +14%
TX SCP+Superior
31 → 37
+6 (biggest SCP gain)
TX Horizon trajectory
16 → 22 → 18
FY23 peak, then -4
FY24-25 net adds (POOL vs Horizon)
+11 / -4
Opposite trajectories

🎯 Sand State counts — toggle banner & year

Banner
Year

POOL (SCP+Superior): FL 42→50 (+8), CA 53→54 (+1), TX 31→37 (+6), AZ 15→16 (+1) · Sand total 141→157 (+16) · Horizon: FL 13→16 (+3), CA 17→20 (+3), TX 16→18 (+2), AZ 9→12 (+3) · Sand total 55→66 (+11). Note the right-axis scale — POOL is ~2-3× Horizon's absolute footprint; the chart shows both on a comparable scale so growth deltas are visually proportional.

📈 Total US trajectory — POOL vs Horizon (dual axis)

POOL (SCP+Superior) US: 259 → 266 → 269 → 279 → 292 → 299 (+40 / +15%, steady additions). Horizon US: 76 → 81 (TWC integration) → 88 → 92 peak FY23 → 90 → 88 (rationalization phase). Horizon is on the LEFT axis (0-100), POOL on the RIGHT axis (0-350). Note the divergence FY23 onwards: POOL still building, Horizon contracting.

Horizon M&A & expansion timeline

Nov 2018 (pre-period)
Turf & Garden, Inc. acquisition — irrigation & landscape distribution. Added 3 VA + 1 NC = 4 locations. Note: this is NOT the "TWC" deal often referenced; it's a distinct earlier deal.
Dec 2020 — biggest single Horizon event in 5 yrs
TWC Distributors, Inc. — irrigation & landscape distribution. Added 9 FL + 1 GA = 10 locations. Drove Horizon US 67 → 76 in one quarter; FL Horizon 4 → 13.
Dec 2021
Wingate Supply, Inc. — added 1 FL location. (Brings FL Horizon to 17 where it stayed through FY24.)
2021-2022 — organic push
9 net greenfields in this window. TX accelerated from 16 → 20 (+4) in FY22. WA expanded 6 → 8. CA added 1.
Mar 2023
Pro-Water Irrigation & Landscape Supply, Inc. — added 2 AZ locations. (AZ 9 → 11.) Last Horizon-banner acquisition in the period.
2024-2025 — rationalization
Net -6 across 2 years. 92 (FY23 peak) → 90 → 88. TX 22 → 20 → 18 (-4 from peak). FL 17 → 17 → 16. CA 19 → 20 → 20 (slight add). AZ 11 → 11 → 12 (one greenfield). No Horizon-banner acquisitions in either year.

Sand State table — Horizon vs POOL (SCP+Superior) FY20-FY25

State Banner FY20FY21FY22FY23FY24FY25 Δ (5yr)
FLHorizon131717171716+3
SCP+Sup424444464950+8
CAHorizon171819192020+3
SCP+Sup535252545454+1
TXHorizon161620222018+2
SCP+Sup313131323637+6
AZHorizon999111112+3
SCP+Sup151515161616+1
Sand subtotalHorizon556065696866+11
SCP+Sup141142142148155157+16
Combined POOL Sand(Hor+Pool)196202207217223223+27
TOTAL USHorizon768188929088+12
SCP+Sup259266269279292299+40

Source: POOL 10-K Item 2 (Properties) FY20-FY25 from SEC EDGAR (see dashboards/pool_locations/SCP_SUPERIOR_FY20_FY25.md for source citations). Reconciliation note: 10-K reports 88 Horizon at 12/31/25; locations.csv shows 92. The 4-loc gap is recent additions in the customer-facing locator not yet in the audited 10-K Properties table. FY24 SCP discrepancy: FY24 10-K shows SCP at 209 for 12/31/23 vs FY23 10-K at 205 — 4-loc reclassification of Sun Wholesale-related locations; per-state data is comparable across years.

📊 What the Horizon-vs-POOL comparison tells us

  • Pool wholesale grew ~2× faster than irrigation in Sand States. SCP+Superior added +16 net Sand State locations vs Horizon's +11 — a 2:1 ratio. Combined POOL Sand-State presence grew 196 → 223 (+14%), and the pool banners did most of the heavy lifting. Horizon is NOT the geographic expansion engine the headline +12 makes it look like.
  • Florida is the standout for BOTH banners — Horizon +3 (TWC integration) and SCP+Superior +8 (steady greenfields + Sun Wholesale absorption). FL's residential housing dynamics and population growth continue to support pool-banner build-out even as Horizon FL flatlines from FY21 onward.
  • TX is the divergent story. SCP+Superior +6 (largest single-state pool gain) WHILE Horizon -4 from FY23 peak. POOL is consolidating irrigation TX branches at the same time it is expanding pool TX branches — these are likely different end-market demand signals (irrigation rationalization on landscape spend softness; pool wholesale expansion on continued in-ground builds + remodels).
  • CA and AZ are flat for the pool banners (+1 each over 5 years). Both are near-saturation: dense existing POOL footprint and slower in-ground new-construction. Horizon outgrew the pool banners in both CA and AZ — the inverse of FL/TX. Different end-market dynamics in the same geography.
  • FY24-25 = the rationalization phase for Horizon, build-out phase for SCP+Superior. Horizon -4 from peak in 2 years. SCP+Superior +11 in those same 2 years. The "driving more value from existing network" message from Q4 25 / Q1 26 calls applies to Horizon, NOT to the pool banners.
  • No Horizon-banner M&A since Mar 2023 (Pro-Water) vs steady SCP-banner deals (Shoreline 2024, Swimline 2024, Great Plains 2025). POOL is deliberately deploying M&A capital into the pool wholesale segment, not irrigation.
  • Heritage-overlap implication: Heritage Landscape Supply (irrigation, SRS-Distribution sister brand) is the real Horizon competitor, not Heritage Pool Supply Group itself. Watch HLPS Sand State expansion specifically — it would directly target Horizon's strongest geography.
Jump to: ⚙ Replacement Cycle (hero) 📈 Narrative Drift 🎙 Industry Experts (AlphaSense) Q1 2026 Q4 2025 Q3 2025 Q2 2025 Q1 2025 IDay 2024

⚙ Replacement Cycle — the two industry-shifting transitions

Why this matters: VS pumps and LED lights are the structural drivers of the equipment lifecycle tracker on Tab 1. These quotes are management explicitly framing the deferral-then-replacement-wave narrative.

Peter Arvan, CEO Q1 2026 earnings call Apr 23, 2026 VS pumps
"...as a couple of pieces of equipment transition to longer life items. So like when the industry moved from single-speed pumps to variable speed pumps, by their very nature, variable speed pumps last longer, sometimes up to 2x longer than a single-speed pump. So if you go back to 2018 when that regulation went into effect, then you just do the — you extend out the life of a variable speed versus single speed, those variable speed pumps that were installed very early on in the transition that would have gone well past the normal life of a single-speed pump. Those will now start coming into the replacement cycle, we believe that."
📄 POOL 1Q26 earnings call, p.12  |  Q&A on equipment replacement cycle
Peter Arvan, CEO Q1 2026 earnings call Apr 23, 2026 Useful life
"The expected life of equipment varies tremendously, based on what the product is and the operating conditions that it's used, whether it's in a seasonal market or whether it's in a year-round market, and whether the product is properly maintained or not and with weather events. In general, part of the value proposition of a variable speed pump is that it runs instead of that full rate under full load all the time. It runs at a lower load which extends the life. It could extend the life by 30%, 40%, 50%, it really depends on many, many other factors. But in general, it has extended the life span of pumps. It doesn't really have much of an impact on filters or anything like that."
📄 POOL 1Q26 earnings call, p.13  |  Q&A on useful life of equipment
Peter Arvan, CEO Q1 2026 earnings call Apr 23, 2026 LED lighting
"...if you look at LED light bulbs for the pool, those certainly on an apples-to-apples basis are going to outlast an incandescent. So since the time that both of those products were introduced we see that there should be opportunity for that replacement market coming up."
Q&A summary Q1 2026 earnings call Apr 23, 2026 Sizing the wave
"Analysts probed for sizing of the VS-pump replacement wave 2028–2032. Management response: directional tailwind, hard to quantify yet."
Source: POOL_InvestorDay_Earnings_Recap.docx — analyst focus summary

📈 Mgmt Narrative Drift Through 2025 → 1Q26

How Arvan's framing of the business changed across 5 consecutive earnings calls. The Q4 25 call is the first explicit articulation of the VS-pump replacement-cycle thesis — Q1 26 expanded it.

CallFraming wordEPS guideNew pool starts citedReplacement-cycle thesisHeritage named?
Q1 25 (Apr 24, 2025)"transition to a more normal industry environment"$11.10–$11.60 affirmedTouched: 4:1 R&M-to-new pump ratioNo
Q2 25 (Jul 24, 2025)"encouraging trends" but "macro uncertainty"$10.80–$11.30 (LOWERED)"down high-single-digit" (permits)Touched: maintenance > replace tradeoffNo
Q3 25 (Oct 23, 2025)"encouraging signs of stabilization"$10.81–$11.31 reaffirmedpermits down mid-single-digit YTDTouched: every new pool gets equipmentNo
Q4 25 (Feb 19, 2026)"year of stabilization" / "bumping along the bottom"FY25 actual $10.85; FY26 initial $10.85–$11.15"just under 60,000" (~half pandemic peak; -40% vs 2022)FIRST EXPLICIT ARTICULATION — VS pump replacement wave + pad modernization opportunityNo
Q1 26 (Apr 23, 2026)"period of stabilization"$10.87–$11.17 reaffirmed (despite +$0.10 beat)58,000 for 2025; 2026 close to thatEXPANDED — 30/40/50% life extension quoted; LED added explicitlyNo

Three observations to flag: (1) Heritage is NEVER mentioned by name in any of 5 calls — competitive references stay generic ("newer folks who have entered the market"); a deliberate non-acknowledgment of the share-shift narrative the AlphaSense experts confirm. (2) The replacement-cycle thesis only became management's explicit talking point at Q4 25 — meaning the structural offset to new-construction softness is a NEW narrative element from FY25 reporting onward. (3) Guide trajectory shows real conservatism: Q2 25 was the one cut, and Q1 26 deliberately did NOT raise FY26 despite the beat.

🎙 Industry Experts (AlphaSense channel checks)

Two recent expert interviews via AlphaSense. Both provide third-party validation of management narratives and surface contrarian data points (pool retirements, channel-conflict from POOL's vertical integration moves, equipment content inflation).

Expert #1

Former President, The Americas — Hayward Holdings

Interview date: December 16, 2025  |  12 pages

Long-tenured executive at one of POOL's top-3 equipment suppliers (Hayward = 11% of FY25 POOL COGS). Speaks from a manufacturer's perspective on channel dynamics, distributor incentive structure, and the Heritage share-shift narrative.

🔒 📄 Open full PDF → (internal source)
Expert #2

VP Operations — High-end Pool Builder, Central Texas

Interview date: April 15, 2026  |  11 pages  |  40+ years industry experience

A direct POOL customer. First-cut spend estimate of 65% POOLCORP "but it is changing" (revised to ~20% later in interview when scope clarified — interpret as POOL share of his current incremental purchasing is dropping fast). Speaks from a builder's perspective on local market dynamics, vendor relationships, and the "competing with the hand that feeds them" channel conflict risk.

🔒 📄 Open full PDF → (internal source)
Heritage Competitive Dynamics — share-shift, pricing, talent, local culture
Former Pres., Hayward Holdings Dec 16, 2025 Share-shift
"There's a share shift going on from POOLCORP to Heritage. Heritage is successfully gaining market share. The issue for Heritage is they have many fewer locations than POOLCORP, like maybe a third. To the extent they can continue to open branches, you would infer from that that they can continue taking market share, but where they currently operate, they're successfully taking market share. I hear it regularly among the contractors that I'm familiar with."
📄 🔒 AlphaSense - Hayward ex-President, p.4 (internal source)  |  This is the quote that anchors the share-shift thesis
Former Pres., Hayward Holdings Dec 16, 2025 Talent moves
"They've taken a lot of people, surprisingly. They've transitioned key individuals... They were hiring very high-level, influential people out of the POOLCORP organization a few years ago and I think that that had some meaningful impact. I think they have promoted themselves very heavily at industry events. They do a lot socialization. They hold concerts and bring people."
📄 🔒 AlphaSense - Hayward ex-President, p.4 (internal source)
Former Pres., Hayward Holdings Dec 16, 2025 Culture/pricing
"They really present themselves and I think it's an actual persona of the management team as people you would sit down and have a beer with. If you're a guy with one truck or you build 12 pools a year, you look at them as people you can identify with. POOLCORP is much more of a corporate persona... I also think Heritage has used price. I think they have sharpened their pencil and given a little bit of additional price. If they're the kind of people you might like to have a beer with and they give you a little bit of price, you start buying over there."
📄 🔒 AlphaSense - Hayward ex-President, p.4 (internal source)
VP Operations, TX Pool Builder Apr 15, 2026 Local execution
"Heritage has been very, I don't want to say aggressive, but very accommodating. They've been price matching very well and have just really done a good job at staffing their branches. I think the overall morale at Heritage has gotten really good in the last couple years. They've got real good management and a very, very good culture. I see them doing very well in the near future and being more and more of a competitor for SCP and POOLCORP."
📄 🔒 AlphaSense - TX Builder VP, p.3 (internal source)
Former Pres., Hayward Holdings Dec 16, 2025 Subtle defection
"When the smaller contractors make that decision, it's so subtle, you don't even know it. They just stop showing up to the store as often to the branch. It's also not a contractual change. What if they just move half their business? What if they do it when it's convenient? The moves are very subtle. They're hard to then react to."
📄 🔒 AlphaSense - Hayward ex-President, p.5 (internal source)  |  Why management may be slow to acknowledge the trend
POOL's Vertical Integration — "competing with the hand that feeds them"
VP Operations, TX Pool Builder Apr 15, 2026 Channel conflict
"I think where POOLCORP needs to be concerned is they're starting to make and manufacture their own equipment. They're also getting into the pool service industry, which means they're competing with their customers. I don't think that's a good move for them. Therefore, that has made us question some of the orders that we have placed with them."
📄 🔒 AlphaSense - TX Builder VP, p.9 (internal source)  |  PoolFX service expansion creating direct channel conflict
VP Operations, TX Pool Builder Apr 15, 2026 Watch list
"I wouldn't say it's completely changed the way that we purchase. I know it's changed the way other people in my market have purchased, but we aren't quite there yet. We're on a high alert for it. It gives us a bad taste in our mouth knowing that they are potentially going to compete with us. We also don't understand why they want to start getting into manufacturing pool equipment because that seems like they're competing with even more of their clients."
📄 🔒 AlphaSense - TX Builder VP, p.9 (internal source)
VP Operations, TX Pool Builder Apr 15, 2026 Advice
"I also think that they need to take a step back sometimes and not try to do too much and compete with the hand that feeds them."
📄 🔒 AlphaSense - TX Builder VP, p.11 (internal source)
Former Pres., Hayward Holdings Dec 16, 2025 Strategic constraint
"The reason POOLCORP doesn't want to own stores, and I don't think Heritage would either, is because they don't want to be perceived as a competitor to their customers. Their customers are pool professionals that come in and buy chemicals and equipment and so on. If you're running a store that competes with that person, it drives a wedge."
📄 🔒 AlphaSense - Hayward ex-President, p.2 (internal source)  |  Pinch A Penny franchise model = same channel-conflict risk applied to POOL
Replacement Cycle & Equipment Content Inflation (cross-reference Tab 1 lifecycle tracker)
Former Pres., Hayward Holdings Dec 16, 2025 Equipment content 3x
"In 2019, a typical pool being built, the opening price point pool had a single pump, a filter, a light, maybe automation. It probably had $4,000-$5,000 in manufacturer revenue of the equipment. A pool now has $15,000-$17,000 worth of manufacturer equipment. It's not all inflation. It's content, it's automation, it's ultraviolet light sanitization, it's chlorine generation from salt pools, it's LED lighting is tremendous."
📄 🔒 AlphaSense - Hayward ex-President, p.9 (internal source)  |  3-3.5x equipment-content-per-pool in just 6 years — explains how POOL grows revenue per unit despite flat unit volumes
Former Pres., Hayward Holdings Dec 16, 2025 VS pump pricing
"Variable speed pumps were starting to take hold. They're much higher ticket, they're probably 5X the cost of an old pump, the pump that existed in 2018."
📄 🔒 AlphaSense - Hayward ex-President, p.10 (internal source)  |  Higher unit price partially offsets cycle extension
VP Operations, TX Pool Builder Apr 15, 2026 VS pump now table stakes
"In fact, I think that's somewhat of a sales tool that is dying. It used to be a way to help sell pools, but everybody uses variable speed, low-energy pumps now."
📄 🔒 AlphaSense - TX Builder VP, p.9 (internal source)  |  Confirms DOE 2021 mandate is now fully diffused
VP Operations, TX Pool Builder Apr 15, 2026 Automation upgrade
"They're upgrading to more automated sophisticated systems... I think the majority is probably convenience and overall control and being able to monitor the chemical usage and water usage. I think a lot of it is the data behind the automation."
📄 🔒 AlphaSense - TX Builder VP, p.8 (internal source)
Pool Retirements — the contrarian data point (challenges installed-base growth)
Former Pres., Hayward Holdings Dec 16, 2025 Net growth de minimis
"There's another issue... about 60,000 in-ground pools are retired every year. Filled in, done away with... That means the net growth in pools is de minimis."
📄 🔒 AlphaSense - Hayward ex-President, p.9 (internal source)  |  60k retirements ≈ 58k new builds → net pool growth is essentially zero. Direct challenge to POOL's 6-9% algo "1-2% installed base growth" bucket.
Former Pres., Hayward Holdings Dec 16, 2025 Normalized starts
"I think we have about 62,000 pool builds now in the U.S. which is a very, very low historical number. You would bet on the upside for that, but not substantially. I think if there were consensus, that consensus would be that normalized starts in a reasonable economy, market economy, would maybe be about 75,000. It's not like we're going to go from 62 to 100. We're not going to see dramatic shifts in pool building."
📄 🔒 AlphaSense - Hayward ex-President, p.3 (internal source)  |  Reset what "normalized" means: 75k, not 95k peak
Former Pres., Hayward Holdings Dec 16, 2025 Aftermarket dominance
"When you look at POOLCORP or anything in the pool space, it's very well-pronounced that we have a strong aftermarket, strong R&R. It's the underpinning. It's 80% of the business. It probably is slightly more than 80% today."
📄 🔒 AlphaSense - Hayward ex-President, p.3 (internal source)  |  Independent confirmation of POOL's 64% non-disc + 22% remodel = 86% aftermarket disclosure
New Construction Affordability — the structural ceiling
Former Pres., Hayward Holdings Dec 16, 2025 Affordability
"The average pool, if you're trying to put in a, I don't want to say basic, but a normal, traditional opening price point swimming pool, it's well over $100,000 now. That number, I think when I started in the industry probably was $60,000 or maybe just under $60,000... I really think that's the economic dilemma the pool industry faces is that middle America can't really afford the house and the pool. If the choice has to be made, it's house."
📄 🔒 AlphaSense - Hayward ex-President, p.3 (internal source)
Former Pres., Hayward Holdings Dec 16, 2025 Premium skew
"We're starting to come to terms with the idea that they don't [have cash] and that pools are going to be for a higher earning segment of the population than they once were. The pools that we're seeing built in that 62,000 population, the majority are higher end pools. There are people of means and wealth that can easily afford to buy a pool, and therefore they're buying a higher value pool even than the opening price point. A $300,000 pool, a $400,000 pool, not terribly uncommon."
📄 🔒 AlphaSense - Hayward ex-President, p.3 (internal source)  |  Mix shift to premium = positive for $ per unit, even with flat units
VP Operations, TX Pool Builder Apr 15, 2026 Texas inflow
"I think this part of Texas is still a very sought-after place to live and grow a family. There's a big business influence as well and big tech hub. We have pretty decent weather and good business policies. With all that, I think we're still going to have the higher end affluent people continuing to move here... and every one of them wants a pool because it's Texas and it's hot."
📄 🔒 AlphaSense - TX Builder VP, p.6 (internal source)
Pricing & Inflation — pass-through dynamics, chemicals, supply shocks
Former Pres., Hayward Holdings Dec 16, 2025 Pass-through
"The pool industry very successfully passes price to the market, very successfully and not in insignificant numbers. In the peak of COVID yes, inflation was enormous. The pool industry was able to push all that price through the distribution channel. Accepted it almost gleefully because they just pass it through and add their margin."
📄 🔒 AlphaSense - Hayward ex-President, p.8 (internal source)
Former Pres., Hayward Holdings Dec 16, 2025 Historical pricing
"It's a very rare point in history that pricing moved less than 2%. Very rare. I have to take the COVID years out, but just this year it was probably, I don't know, 6%."
📄 🔒 AlphaSense - Hayward ex-President, p.8 (internal source)  |  Equipment-side pricing — POOL CFO says blended 1-2% pricing in FY26 guide is conservative
Former Pres., Hayward Holdings Dec 16, 2025 Chemical deflation
"Are you aware there were two significant chlorine production interruptions, not just COVID related. There was a fire and 2X in a chlorine production facility in the U.S. which caused people to hoard chlorine. Chlorine prices went crazy... I think the deflation in chemicals is probably that coming out... I don't think the chemicals can continue to deflate for five years."
📄 🔒 AlphaSense - Hayward ex-President, p.9 (internal source)  |  Trichlor pricing dynamic: BioLab fire 2020 inventory hoarding now unwinding
VP Operations, TX Pool Builder Apr 15, 2026 2026 increases
"Different manufacturers and different items by the manufacturer went up differently. Some stuff, anywhere from 3% to I think upwards of 20% on certain items, maybe heaters... I think in a whole, I would say probably 5%-7%."
📄 🔒 AlphaSense - TX Builder VP, p.7 (internal source)
Supplier Dynamics — distributor as commodity, rebate economics
Former Pres., Hayward Holdings Dec 16, 2025 Undifferentiated cost
"It's not differentiated. There are some insignificant differences. POOLCORP can take more advantage of special incentives and promotions like the early buy, they can commit to larger orders... The day-in, day-out acquisition cost of the goods is undifferentiated."
📄 🔒 AlphaSense - Hayward ex-President, p.7 (internal source)  |  Implies Heritage's COGS is comparable to POOL's — they can match price
Former Pres., Hayward Holdings Dec 16, 2025 Rebates
"It's all rebate driven. Whatever they acquire in the given year, they get a rebate that's double digit. It's substantial. Bigger you are, the more it is. The more strategic you are, the more it is. That's where the real competition exists."
📄 🔒 AlphaSense - Hayward ex-President, p.7 (internal source)  |  Double-digit volume rebates explain POOL's gross-margin leverage on scale
Former Pres., Hayward Holdings Dec 16, 2025 Distributor as order-taker
"They're indifferent to which line of equipment they sell. A manufacturer has to spend tremendous resources downstream from the distributor to create demand. We have to go call on all the builders, we have to see the service contractors, we have to promote the goods, we have to train. The distributor just services the business that comes through... If you walk into a POOLCORP branch and ask for a Pentair pump, they're just going to give it to you. They're not going to say, 'Have you seen the new Hayward pump?'"
📄 🔒 AlphaSense - Hayward ex-President, p.7 (internal source)
Former Pres., Hayward Holdings Dec 16, 2025 Disintermediation risk
"There's just nothing in the DNA of a manufacturer that wants to disintermediate the channel in the U.S. predominantly because you just have two big distribution platforms and if you alienate them in any way, the risk of them pulling your line is too great."
📄 🔒 AlphaSense - Hayward ex-President, p.6 (internal source)  |  Why Pentair/Hayward won't go direct-to-builder
Channel Structure — branch picked-up, POOL360, retail
Former Pres., Hayward Holdings Dec 16, 2025 Picked-up 60-80%
"POOLCORP claims that it's 60%-80% picked up. The pool professional, probably because of their fragmented nature, maybe because the aftermarket is so significant and you're not shipping mass quantities, just one pump here, one thing there, it's 60%-80% picked up. The branch becomes an important thing."
📄 🔒 AlphaSense - Hayward ex-President, p.5 (internal source)  |  The why-branch-density-matters quote — directly relevant to Heritage 65.6% within-5-mi finding (Tab 4)
Former Pres., Hayward Holdings Dec 16, 2025 POOL360 limits
"It should be good. They've invested in it for a long period of time. I think all those digital tools are helpful and potentially differentiating. The dynamic of having 70% of the volume going as walk-in customers, I think pushes back against digital tools to some extent... Home Depot will deliver to my home a $20 item within three or four hours. That type of service is excellent... pool360 can offer some of that, except their model is not to deliver."
📄 🔒 AlphaSense - Hayward ex-President, p.11 (internal source)  |  Tempers POOL360 thesis — picked-up volume limits digital uplift
VP Operations, TX Pool Builder Apr 15, 2026 POOL360 pricing complaint
"I think they can offer better pricing, more consistent pricing. I think that they need to make sure their online POOL360 portal is updated to the most recent builders pricing because we have found where pricing on the website is not accurate for what my deal is with the distributor, depending on what our kickbacks are."
📄 🔒 AlphaSense - TX Builder VP, p.11 (internal source)
Industry Consolidation — Heritage divestment scenarios, Ferguson
Former Pres., Hayward Holdings Dec 16, 2025 HD divestment scenario
"It wouldn't surprise me if Pool and Landscape was divested. It's not really core. It's certainly not core to SRS and construction materials... They probably have to spin it to their shareholders. They could IPO it. POOLCORP could not buy it... Ferguson would be a really interesting play, expanding their presence in the water and plumbing side. That would be really interesting."
📄 🔒 AlphaSense - Hayward ex-President, p.5 (internal source)  |  M&A optionality: Heritage may not stay with HD; antitrust prevents POOL acquisition; Ferguson the natural buyer
Former Pres., Hayward Holdings Dec 16, 2025 POOL benefit
"I think it's actually good for POOLCORP to have Heritage. Frankly, they need someone to chase. In the years leading up to that they were dominant. They were making all the acquisitions. No one else was acquisitive. Sometimes a business can get to a point where, I don't know, it's a little too easy and they're overconfident."
📄 🔒 AlphaSense - Hayward ex-President, p.10 (internal source)  |  Bull-case framing: competition forces POOL to optimize
Sand State Geography & Pinch A Penny Network
Former Pres., Hayward Holdings Dec 16, 2025 FL anecdote
"I live in Florida. There are many pool distributors here, many branches. There is not a Heritage branch near me. There is a POOLCORP branch 20 minutes away. I would go over an hour to get to a Heritage branch. In my community, no one's buying from Heritage. If they opened a branch, I'm sure they would take share, at least initially. New guy in town."
📄 🔒 AlphaSense - Hayward ex-President, p.5 (internal source)  |  Personal anecdote — "where Heritage hasn't opened" → POOL keeps share, but every new Heritage greenfield is direct SSS pressure
Former Pres., Hayward Holdings Dec 16, 2025 Pinch A Penny scaling
"POOLCORP has not expanded Pinch A Penny very much, 10 or 12 stores a year. I don't think it's easy to find franchisees."
📄 🔒 AlphaSense - Hayward ex-President, p.2 (internal source)  |  Constraint on retail-channel monetization
Former Pres., Hayward Holdings Dec 16, 2025 DIY decline
"I think the do-it-yourself pool service has diminished some. I think the pool market is very, very flat."
📄 🔒 AlphaSense - Hayward ex-President, p.2 (internal source)

📞 Q1 2026 Earnings Call

Apr 23, 2026  |  Speakers: Peter Arvan (CEO), Melanie Hart (CFO)  |  Arvan's last earnings call — stepped down May 4, 2026 (~10 days after this print). Verbatim quotes from POOL_1Q26_call.txt

Thesis & installed base
Peter Arvan, CEO Thesis
"Our growth thesis does not require a recovery in new pool units. It is anchored in maintenance, remodel and share capture across product categories for the existing installed base."
Page 6
Peter Arvan, CEO Center of gravity
"New pool units for 2025 came in at 58,000. While we expect 2026 will be close to that level, it is important to remember that the center of gravity of our business is the 5.5 million in-ground pools already installed."
Page 5-6
Peter Arvan, CEO Discretionary mix
"A pump and a filter, non-discretionary. If those need to be replaced or repaired, they have to be replaced or repaired. But you get into heaters and/or lights, something like that. If somebody doesn't want to fix that... you don't actually have to have that to continue to safely operate the pool. So in some areas, that's where we have seen some decline in demand. But I would tell you that, that's already in and baked in."
Page 11
Product category growth & gross margin
Peter Arvan, CEO Category growth
"Chemicals grew 8% on strong volume with standout contributions from our proprietary and private label lines, which carry structurally higher margins and are gaining traction across the enterprise."
Page 5
Melanie Hart, CFO GM rank
"Building materials having the best margin and then after that would be chemicals, and then after that would be equipment."
Page 10
Melanie Hart, CFO Equipment surprise
"Equipment sales grew 7% in the quarter and given the lower relative margins of this category, the strong volume performance diluted consolidated gross margin. We view this growth as strategically positive."
Page 7
Inventory positioning
Peter Arvan, CEO Health
"The profile is what I would characterize as extremely healthy. We're actually very astute buyers when it comes to buying inventory... they're sitting in very high moving items. So I really — from an inventory perspective, I spend very little time worrying about the inventory levels."
Page 15  |  Re: the +$200M Q1 inventory build to ~$1.7B
Melanie Hart, CFO Drivers
"Stocking for new locations and acquisitions added to the network, new product introductions resulting in a broader product range and cost inflation relative to the same period last year, with some opportunistic purchases made ahead of current season price increases."
Page 7
Private label & new product
Peter Arvan, CEO Private label positioning
"I wouldn't want anybody to position our private label as a down price offering... we're trying to have an offering that has tremendous value and is very high quality."
Page 11
Peter Arvan, CEO New product
"[An example is] a proprietary bandless antimicrobial cartridge filter, which is much faster to service and has a very low micron filtration rate, helping produce clearer pools and complementing LED lights which are getting brighter."
Page 15  |  Note the cross-reference to LED tech in core equipment design
POOL360 digital
Peter Arvan, CEO POOL360
"I don't see any reason why the company couldn't ultimately exceed 25% target [POOL360 penetration] and maybe higher in the future."
📄 POOL 1Q26 earnings call, p.16  |  1Q26 was 13% (vs 12.5% 1Q25), FY25 full-year was 15% per Q4 25 call (Arvan on this Q1 26 call said 17% but that was the Q3 25 peak), some branches >30%

📞 Q4 2025 / Full Year Earnings Call

Feb 19, 2026  |  Speakers: Peter Arvan (CEO), Melanie Hart (CFO)  |  Verbatim quotes from POOL 4Q25 earnings call 02.19.26.pdf. Stock pre-market reaction: -10.7% as Q4 EPS missed by 14%. First explicit articulation of the VS-pump replacement-cycle thesis.

Headline framing — the "year of stabilization"
Peter Arvan, CEO Year framing
"This was the year of continued industry developments, shifting demand patterns, persistent customer uncertainty, and evolving customer expectations."
Peter Arvan, CEO New construction
"In 2025, we estimate that just under 60,000 new pools were built in the U.S. amid single-digit decline from last year. This is about half of what we saw at the height of the pandemic and 40% lower than in 2022."
Melanie Hart, CFO End-market mix
"We estimate that maintenance items accounted for roughly 64% of our pool product sales, while renovation and remodel projects made up 22%, and new pool construction contributed 14%."
📄 POOL 4Q25 earnings call, p.5  |  The 64/22/14 mix is direct from CFO (also in 10-K)
⭐ Replacement cycle — FIRST EXPLICIT ARTICULATION
Peter Arvan, CEO VS pump wave
"There's a couple of things that we're going to start to see benefit from as it relates to equipment. So when the industry switched from single speed motors to variable speed motors, they inherently lasted longer, but now we're starting to get close to the period where from when we started selling a lot of single speed motors or single speed pumps to variable speed pumps, that they will start coming into their replacement cycle, number one."
📄 POOL 4Q25 earnings call, p.13  |  This is the seed of the thesis that Arvan expanded with the 30/40/50% number on Q1 26.
Peter Arvan, CEO Pad modernization
"Number two, I still believe that there is a significant opportunity to modernize the pad. If I looked across the, we talked to many, many customers, we talk about what they're seeing in the backyard when they go into these backyards and they look, if what we were seeing over and over again was ultra-modern pads are fully adopted everything that is available to the consumer, I would say, okay, so now we're more in a replacement cycle, but today what I would say is there is still an outsized opportunity to modernize the pads with the new equipment."
📄 POOL 4Q25 earnings call, p.13  |  Cross-ref to Hayward expert's "$4-5k → $15-17k equipment per pool" content-inflation framing
Product category growth (FY25)
Peter Arvan, CEO FY25 category mix
"Chemicals were down 1% for the year, mostly due to price, and 3% in the fourth quarter... Building Materials finished flat for the year and were up 4% in the fourth quarter, driven by demand for our national pool trend products... Equipment sales, excluding cleaners, were flat year-over-year and down 3% in the fourth quarter, cycling against prior year hurricane recovery comps. Commercial pool products rose 3% for the year."
Inventory positioning
Melanie Hart, CFO Year-end position
"Inventory at year end was $1.45 billion, an increase of $165 million or 13% from last year's balance of $1.29 billion."
Peter Arvan, CEO Pre-price-increase buys
"Inventory, as we have done successfully in the past, we acted opportunistically to secure pre-price increase purchases. This proactive investment positions us to protect and expand our gross margins."
POOL360 — the authoritative FY25 number
Peter Arvan, CEO FY25 penetration
"Digital sales reached 13.5% of total revenue in the fourth quarter, up from 12.5% last year and peaked at a record 17% during the pool season. For the full year, we finished at 15% of sales, which is an all-time high."
📄 POOL 4Q25 earnings call, p.3  |  This is the authoritative FY25 POOL360 number = 15%. Arvan misspoke on Q1 26 saying "17% for the year" — that was the Q3 25 peak.
FY26 guidance initiated
Peter Arvan, CEO FY26 guide
"With all these factors in mind, our diluted EPS range for 2026 is $10.85 to $11.15."
📄 POOL 4Q25 earnings call, p.3  |  Midpoint implies ~2-3% growth vs FY25 $10.85 — well below 6-9% long-term algo
Peter Arvan, CEO Capital return
"We delivered our commitment to shareholder returns, distributing $530 million in cash this year, a 10% increase over last year. This includes $341 million in share repurchases and a 4% increase in our quarterly dividend."
Melanie Hart, CFO Incentive comp reload
"Assuming we achieve low single-digit growth revenue, incentive-based compensation expenses are projected to rise by $10 million to $15 million."
📄 POOL 4Q25 earnings call, p.6  |  Drag on operating leverage in FY26

📞 Q3 2025 Earnings Call

October 23, 2025  |  Speakers: Peter Arvan (CEO), Melanie Hart (CFO)  |  The "stabilization" quarter — first BM growth since Q3 2022.

Headline — the trend inflection
Peter Arvan, CEO Stabilization
"I'm excited to share that our teams have maintained the momentum we established in the second quarter, delivering another solid performance in Q3... This was fueled by consistent maintenance activity and encouraging signs of stabilization in both new pool construction and remodel."
Peter Arvan, CEO BM inflection
"I'm also pleased to see that we achieved year-over-year growth in building materials for the first time since Q3 of 2022, driven by improvements in remodel activity and share gain."
📄 POOL 3Q25 earnings call, p.2  |  First BM growth in 12 quarters
Category growth
Peter Arvan, CEO Q3 mix
"Total chemical sales declined 4% this quarter, reflecting some additional deflation... Building materials sales increased 4%, again driven by our expansive private label offering... Equipment sales, which excludes cleaners, increased 4% during the quarter, mostly reflecting benefit from price and steady replacement volume for critical components."
Peter Arvan, CEO NPT rebrand
"We recently rebranded NPT, formerly National Pool Tile to National Pool Trends to align our brand name and marketing efforts..."
📄 POOL 3Q25 earnings call, p.3  |  Strategic broadening from tile-only to outdoor-living finishes
Replacement cycle context
Peter Arvan, CEO Component replacement
"Of course, every new pool gets a set of equipment. A portion of the renovation and remodel will get — we'll get new equipment, but the vast majority of the products that we sell are related to a — one of the critical components on the pool failed and had to be replaced, whether it was a pump or whether it was a heater or filter, lights."
POOL360 — the peak quarter
Peter Arvan, CEO All-time-high quarter
"Sales through the tool represented an all-time high of 17% of our total sales for the third quarter, which demonstrate the customer's desire for technology that creates value."
📄 POOL 3Q25 earnings call, p.3  |  This is the 17% Arvan later mis-cited as FY25 on Q1 26 — it was peak quarter only.
Peter Arvan, CEO Path to 25%
"We were at 17% for the quarter, which is an all-time high for us. We have people that are nearly double that... Do I think we could be as a company 25%, 30%? Yeah, I think we could — I think we absolutely could do that."
Pricing
Melanie Hart, CFO Q3 pricing
"We realized a 3% benefit from pricing, reflecting the full-quarter impact of price realization on the mid-season vendor price increases implemented in April and May. Trichlor selling prices continued to be impacted by the lower level of spend in the industry."

📞 Q2 2025 Earnings Call

July 24, 2025  |  Speakers: Peter Arvan (CEO), Melanie Hart (CFO)  |  The quarter that LOWERED full-year guide ($11.10-$11.60 → $10.80-$11.30).

Headline — solid but lowered guide
Peter Arvan, CEO Q2 framing
"We were very pleased to see positive sales growth in the second quarter, along with stable gross margins and steady operating margins versus the prior year. Given all the challenges affecting the broader economy and industry dynamics, I consider these results to be very solid."
Peter Arvan, CEO Rates / new construction
"Without an interest rate cut, that will address the greater housing market. I think it would be tough to say that we believe that new pool construction is going to rebound this year."
Maintenance / aftermarket resilience
Peter Arvan, CEO Aftermarket
"One of the shining stars is the fact that the maintenance and repair business of the growing install base is still very resilient. People still love their pools."
Peter Arvan, CEO Fix vs replace
"Our parts sales are outpacing total sales growth in almost every market. So I think that there are some trade-offs being made with, well, can I fix it versus replace it?"
Peter Arvan, CEO Pump non-discretionary
"If your pump has failed, whether your pump is 10% more or 5% more or 2% more than it was last year, I really think it's irrelevant. You have to replace the pump."
📄 POOL 2Q25 earnings call, p.8  |  Early articulation of the "pump/filter non-discretionary" quote later refined on Q1 26
Trichlor pricing
Melanie Hart, CFO Trichlor deflation
"Chemicals, specifically Trichlor, are seeing selling prices less than what we saw in the second quarter of prior year. This pricing, although lower than last year, still represents a significant premium over 2020."
📄 POOL 2Q25 earnings call, p.5  |  Matches Hayward expert's "deflation = post-2020 hoarding inventory coming out" framing
POOL360
Peter Arvan, CEO Q2 25 = 17%
"POOL360 platform transactions now represent 17% of net sales, up from 14.5% last year, reflecting enthusiastic customer adoption and creating durable competitive advantages that are hard to replicate."
Guidance cut
Peter Arvan, CEO FY25 guide CUT
"In the absence of an interest rate cut or external catalyst, we are updating our diluted earnings per share guidance for the year to a range of $10.80 to $11.30, which includes a $0.10 realized benefit from the ASU year-to-date."
📄 POOL 2Q25 earnings call, p.4  |  Cut from $11.10-$11.60 to $10.80-$11.30 — the only guide cut in the 5-call sequence

📞 Q1 2025 Earnings Call

April 24, 2025  |  Speakers: Peter Arvan (CEO), Melanie Hart (CFO)  |  Pre-tariff context: April tariff actions just announced, vendor price increases follow.

Headline framing
Peter Arvan, CEO Macro
"At the time of our last call, there appeared to be some signs of macro stability approaching, but we have seen the challenging economic environment continue to weigh on new pool construction and, to a lesser degree, renovation activities."
Tariff / pricing pass-through (April 2025 tariff response)
Peter Arvan, CEO Tariff pass-through
"Since our last earnings call, our largest equipment vendors announced and implemented an in-season price increase that ranged from 3% to 4% that took effect in April to address the March tariff announcements, and we increased our selling prices accordingly. We observed similar patterns during the pandemic years, and those increases passed through the channel with no reversals."
Peter Arvan, CEO Direct import exposure
"Our exposure to direct imports in total is relatively small and would amount to less than 1% of revenue... The biggest tariff impact in our business is being felt in the equipment area, where the manufacturers have exposure for whole goods or components that are impacting their costs."
Replacement cycle — the 4:1 ratio
Peter Arvan, CEO 4:1 R&M ratio
"As a rule of thumb, we look at equipment and say for every pump we would sell for a new pool, we probably sell four for repair and maintenance."
📄 POOL 1Q25 earnings call, p.18  |  The 4:1 R&M-to-new ratio is the single best heuristic for understanding why new-construction softness underweights to total revenue
Peter Arvan, CEO Tech demand
"People are still very tech, the demand for tech for new pool equipment, especially if somebody's going to spend that kind of money to replace something that should have a 10-year lifespan, they're not looking to go backwards and say, hey, give me old technology and mechanical time clocks and no automation."
📄 POOL 1Q25 earnings call, p.18  |  Equipment content/sophistication thesis — supports the Hayward expert $4-5k → $15-17k content quote
Competition (generic — Heritage not named)
Peter Arvan, CEO Competitive framing
"The competitiveness from a price perspective is nothing new. Most of our competitors that we have, whether it's the newer folks that have entered the market or the traditional players, in terms of their value proposition to the market, don't have what we do. So the way that they compete with POOLCORP is they walk in and say, whatever POOLCORP is selling you for, we will sell it to you for less."
📄 POOL 1Q25 earnings call, p.14  |  "Newer folks who have entered the market" is the indirect reference to Heritage. Note: Heritage never named directly across any of the 5 calls.
Melanie Hart, CFO Aggressive pricing
"We saw some instances of aggressive competitive pricing for certain orders that appears to be in response to continued softness in the market."
📄 POOL 1Q25 earnings call, p.6  |  CFO acknowledgment of Heritage price-matching behavior described by the TX builder expert

🎤 Investor Day 2024 — Austin, TX

March 19, 2024  |  Speakers: Peter Arvan (then-CEO), Melanie Hart (CFO), Kenny St. Romain (SVP NA pool), Kris Neff (VP Strategy), Todd Marshall (CIO)

⚠ Highlights from POOL_InvestorDay_Earnings_Recap.docx Unison synthesis. Full IDay transcript not in our raw folder.
The long-term growth algorithm
Melanie Hart, CFO 6–9% algo (slide 15)
Long-term sales growth algorithm: 6–9%. Composition: 4–6% industry growth (1–2% inflation + 1–2% installed base + 1–2% new construction) plus 2–3% from above-market growth (new products + share gain + Pinch A Penny + acquisitions). Bear case today: installed-base growth has slowed to ~0.7% and new construction is at trough.
Melanie Hart, CFO Financial framework
Gross margin: ~30% steady-state (vs ~29% historical — 50bps benefit from Pinch A Penny, balance from supply chain + private label). Operating margin: ~20bps annual expansion target, ~13% long-term. Capex 1.0–1.5% of net sales. M&A $25–50M/yr in bolt-ons. Cash conversion ~100% of net income.
TAM & share
Management (slide 8) TAM
$37B "relevant POOL TAM": US Residential Pool $12B + US Commercial $2.4B + US Irrigation/Landscape $16B + US Hardscapes $3B + International $3.6B. POOL share on the broad TAM = ~14% (FY24). On the cleaner US 2-step pool wholesale base (~$7.25B), POOL share is ~63%.
Management Track record
Industry growth from $10B (2019) to $12B (2024) — a ~3.7% CAGR. POOL grew from $3B (2019) to $5.5B (2023) — meaningfully outpacing the market and demonstrating share gain. Operating margin: 10.7% (2019) → 13.5% (2023).
Sales-center performance distribution (slide 65 — new data at IDay)
Kenny St. Romain, SVP NA pool Branch P&L distribution
20% of branches operate at >20% operating margin  |  35% at 16–20% OM  |  33% at 10–15%  |  8% on the "Focus List" <10%  |  4% are new/acquired <12 months. Management explicitly targets getting most branches to 20%.
Analyst focus at the event
Carter, Stifel Heritage / HD
Pricing power vs. Heritage; risk of Home Depot direct disintermediation. Arvan response: "no new competition, just a roll-up" — POOL's tech, tenure, and supplier relationships not replicable by Heritage at the same speed.
Merkel, William Blair Private label strategy
Expansion of private-label into equipment? Arvan: no — POOL won't compete with its largest suppliers. PL stays in chemicals + building materials. This is the structural constraint on the Pentair/Hayward/Zodiac (43% of COGS) concentration risk.
Manthey, Baird Network optimization
CSL (centralized shipping location) network optimization; case for adding facilities in Texas/Nevada like the Clearwater FL plant. POOL currently runs 4 CSLs in the US + 1 in Europe.

🧭 Synthesis — what changed across the three events

The Investor Day 2024 narrative is increasingly stretched. Management has not abandoned the 6–9% long-term algorithm, but the FY26 guide ($10.87–$11.17 EPS) implies only 2–3% growth. The Q1 2026 beat ($0.10) was NOT used to raise the full-year guide — a signal of caution about the back half despite the early momentum. The replacement-cycle quotes (above) are the most recent and most specific articulation of the structural offset to new-construction softness. Watch the next two prints (Q2 July 23, 2026 + Investor Day May 12, 2026 follow-up) for whether the equipment replacement wave starts showing in numbers.
Source: POOL_InvestorDay_Earnings_Recap.docx, Unison synthesis

Heritage Pool Supply Group — is it following POOL's footprint or building independently?

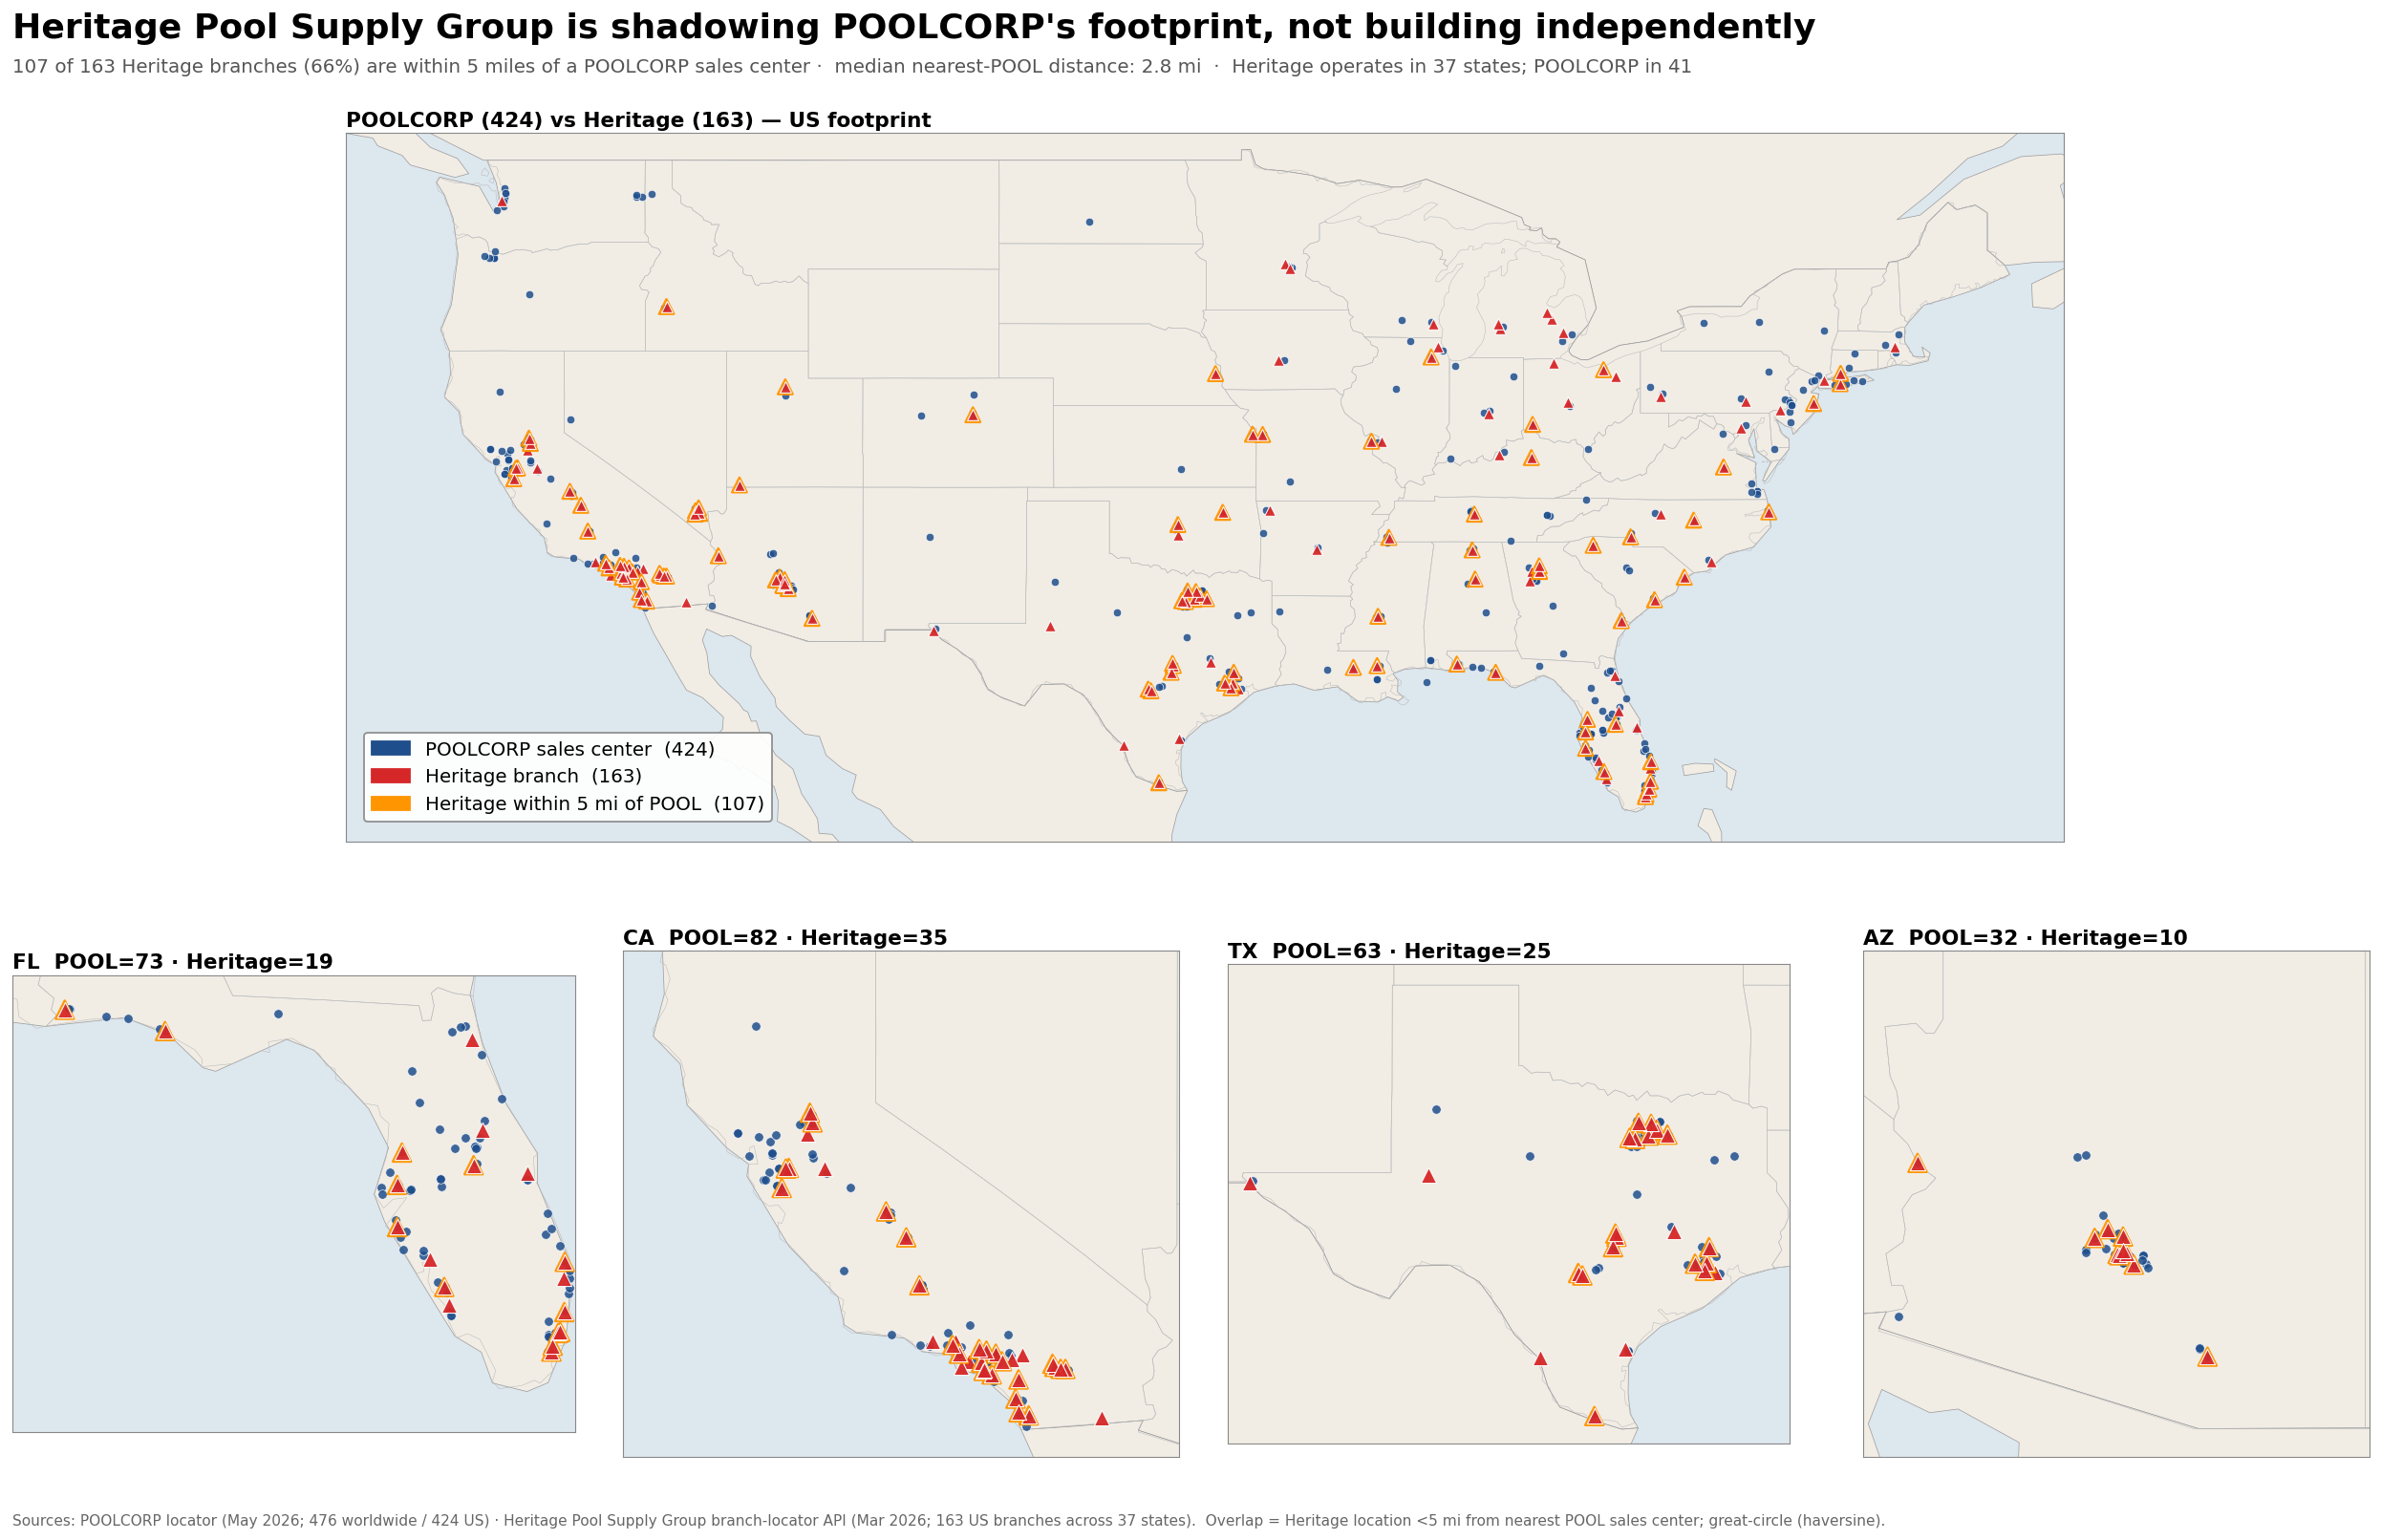
Emphatically following. Heritage is shadowing POOLCORP's footprint, not building independently. 107 of 163 Heritage branches (65.6%) sit within 5 miles of an existing POOL sales center; 84% are within 10 miles. The median Heritage branch is 2.78 miles from the nearest POOL location. Heritage operates in 37 states — every one of which POOL also serves — and there are zero Heritage-only states.

Source data: dashboards/pool_locations/heritage_overlap_metrics.json  |  Findings doc: dashboards/pool_locations/HERITAGE_OVERLAP.md  |  Scraped May 20, 2026 via scrape_heritage_xhr.py from the HPSG /api/branchList/features/ endpoint

Heritage US branches
163
37 states
POOL US branches
424
41 states + PR
Within 5 mi of POOL
65.6%
107 of 163
Within 10 mi of POOL
84%
137 of 163
Median nearest distance
2.78 mi
25th pct: 0.68 mi
Heritage-only states
0
truly white-space: 8 branches

Heritage vs POOL — interactive overlay

POOL locations (424)  |  Heritage locations (163)  |  toggle layers with the top-right control · click any marker for details

Distance from each Heritage branch to nearest POOL

Right-skew is dramatic: more than 100 of 163 branches sit within 5 miles. The few >50mi outliers are pure white-space (8 branches: Laredo TX, Midland TX, Saginaw MI, Maui HI, etc.).

State coverage — both / POOL-only / neither

POOL-only states (4): OR (5 br), NM (1), ND (1), WV (1) = 8 branches total. Heritage-only states: 0. 10 states (mostly low-pool-density rural + AK/DC) have neither.

Sand State zoom (FL/CA/TX/AZ)

Heritage = 89 of 163 branches (55%) concentrate in the Sand States. 74% of those 89 are within 5 mi of a POOL — i.e. the share-shift threat is structurally aimed at POOL's most valuable geographic concentration. CA gap is widest at 82 POOL vs 35 Heritage (43% coverage ratio).

Heritage brand mix (163 branches)

Heritage Pool Supply is the consolidated front-end brand (134 / 163 = 82%). The corporate-structure §2 from HERITAGE_CONTEXT.md lists ~12 brands; most appear consolidated into HPS in the API. Recreonics (1 in API vs national commercial network per acquisition press release) is under-represented — may operate under separate portal.

State-by-state coverage detail

StatePOOLHeritageH/P ratioStatus

Sortable rendering. Heritage/POOL ratio shows where Heritage has caught up most aggressively: HI is the standout (Heritage 4 vs POOL 2 = 200%) but POOL effectively wasn't there before the Island Pool & Spa acquisition. MI 5 vs 3, OH 5 vs 4, OK 4 vs 4 are other Heritage-overweight states. Heritage is meaningfully under-indexed in NY, NJ, NV vs POOL.

Static map (with Sand State insets)

Generated by build_heritage_map.py. 1 US panel + 4 Sand-State zoom insets. POOL blue dots, Heritage red triangles, orange rings around within-5mi overlaps.

Heritage vs POOL Static Map

📈 Investment implications & share-shift thesis

  • The headwind is broad-based, not isolated. Heritage now has presence within 10 miles of POOL in 84% of POOL's network. POOLCORP's "same-store-sales (SSS) drag from Heritage" headline cannot be dismissed as a 1–2 market issue — every greenfield Heritage opens should be modeled as direct SSS pressure on the nearest POOL branch.
  • No TAM expansion left for Heritage in 99% of cases. Only 8 of 163 Heritage branches (4.9%) are truly white-space (>50mi from any POOL). Heritage's growth model is share-take, not market creation.
  • The Sand State threat is concentrated where it hurts most. 74% of Heritage's 89 SS branches are within 5 mi of a POOL. POOL's 53% of FY25 sales from CA/FL/TX/AZ (10-K) is the most exposed slice. CA is the largest gap (POOL 82 vs Heritage 35 = 43% Heritage coverage) and the highest-revenue state — meaningful runway for Heritage greenfields in CA without TAM expansion.
  • The 4 POOL-only states are immaterial. OR, NM, ND, WV combined = 8 POOL branches. Heritage's choice not to enter is rational — these are low-pool-density markets.
  • Confirms the duopoly structure (task #10). The wholesale 2-step pool distribution market is now a POOL+Heritage duopoly:
    • POOL US: 424 branches, ~62% share, ~$4.6B revenue
    • Heritage: 163 branches, ~16% share, ~$1.2B revenue
    • All other regional independents: ~100 branches, ~4% share, ~$300M (per Pool_Distributors_Data.xlsx > Chain_vs_Indep)
    • No third national competitor at Heritage's scale exists. POOL is rolling up the tail (Shoreline 2024, Swimline 2024, Great Plains 2025).
  • Map this back to the 1Q26 commentary. Arvan's IDay 2024 framing was "no new competition, just a roll-up" — that quote is increasingly hard to defend with 65.6% of Heritage branches inside 5 miles of POOL and Heritage gaining share per channel checks. Watch for an updated articulation at the May 12, 2026 Investor Day follow-up or Q2 print (Jul 23).

🌐 Public catalog asymmetry — Heritage Pool Plus is open-web, POOL360 is dealer-gated

Recon of every POOL- and Heritage-controlled e-commerce property (May 2026) found a structural go-to-market divergence: Heritage Pool Plus runs a ~74,000-URL public Magento catalog with no login wall, while POOL's flagship digital channels (POOL360, SCP, Superior, NPT) all gate the catalog behind dealer authentication. This isn't a parity gap — it's a deliberate strategic choice on both sides.

Site-by-site public-catalog audit

SiteOwnerPublic sitemap?Public catalog?URLs / products
heritagepoolplus.com Heritage Yes (5 sub-sitemaps) YES — no login 73,980 URLs
recreonics.com Heritage (commercial) Yes (4 product sitemaps) YES — no login 3,218 products · 272 categories
heritagepoolsupplygroup.com Heritage (corp) Yes N/A (corporate) ~50 pages
pool360.poolcorp.com POOL No NO — dealer auth Gated (15% of FY25 net sales)
scppool.com POOL No public sitemap NO Next.js, no product feed exposed
superiorpoolproducts.com POOL No NO
nptpool.com POOL 1 sitemap (1 URL) NO Dealer/contractor finder only (/api/dealers public — 106 FL contractors)
texaspoolsupply.comHeritage (local brand)Redirects→ HPSG "South Region" page
poolbuilderssupply.comHeritage (local brand)Redirects→ HPSG "Southeast Region" page
aquafinity.comHeritage (commercial)YesNo (marketing site)142 pages
belaquapoolsupply.comHeritage (local brand)PARKED at GoDaddy despite active brand (2022 NJ greenfield)
mtpooldistributors.comHeritage (Nov 2025 acq)NoMinimal (post-acq integration)

Source: recon scrape May 2026, dashboards/pool_locations/raw/ecommerce/deep_recon.json + SCRAPE_FINDINGS.md. All Heritage Pool Plus URLs available as a 7.5 MB seed file (heritagepoolplus_all_sitemap_urls.txt) for any future targeted SKU-bucket extraction.

The two readings — what this divergence means

📈 Heritage's bet

Open catalog = SEO/search visibility for product queries, lower friction for DIY-homeowner cross-sells and sub-dealer prospecting. Heritage is courting the digital-search funnel that POOL has chosen not to compete in. Consistent with the Hayward expert's read that Heritage is "sharpened their pencil" on pricing and culture — public pricing is the logical extension.

⚠ The trade-pricing risk

Publishing prices openly weakens trade-only pricing differentiation — Heritage's pro customers see the same prices a consumer sees. POOL360's gated stance deliberately preserves the "professional-only" trade discount, matching Arvan's repeated "we serve the pool pro, not the homeowner" framing. If Heritage's open-catalog channel cannibalizes its own trade margins, the share-shift narrative could partially reverse as Heritage's gross margin compresses.

🔍 What it enables for analysts

Heritage's catalog is publicly inspectable — pricing, availability, brand mix, SKU breadth, all observable without dealer credentials. This makes Heritage's gross margin materially easier to model than POOL's: targeted weekly scrapes of a 1,000-2,000 SKU bucket (e.g., variable-speed pumps, premium plaster finishes) would yield a real-time pricing/inventory time series. POOL has no equivalent visibility into its own catalog without dealer credentials, let alone Heritage's.

💡 Investment implications — the e-commerce dimension

  • Heritage's 74K-URL public catalog is a genuine moat and a vulnerability. Moat: search visibility, sub-dealer leads, DIY traffic. Vulnerability: open prices erode the trade-pricing differentiation that distributors live on. Net effect depends on whether Heritage holds margin while POOL holds trade share.
  • POOL360's 15% of FY25 net sales is dealer-only traffic — a fundamentally different mix from Heritage Pool Plus's open-web visitors. The 15% should NOT be compared to Heritage Pool Plus directly. POOL's POOL360 is incremental dealer ordering efficiency; Heritage Pool Plus is a top-of-funnel customer-acquisition channel.
  • The Bel-Aqua parked-domain tell. An "active" Heritage brand (Lakewood NJ 2022 greenfield per press releases) with a domain parked at GoDaddy suggests the multi-brand strategy is more nominal than operational at the web layer — physical branches are real but local-brand digital presence is patchy.
  • Future-extension paths if the user wants this monitored:
    • Targeted SKU-bucket pricing scrape (1k-2k Heritage Pool Plus products in a chosen category) → gross-margin model
    • Recurring weekly in-stock/out-of-stock ratio for Heritage → supply-chain proxy with no POOL equivalent
    • Cross-link Heritage catalog by acquired-brand mix (HPS / Aquafinity / Recreonics / etc.) to validate the 12-brand corporate-structure footprint

Methodology & data quality notes

  • Heritage data source: https://www.heritagepoolsupplygroup.com/api/branchList/features/ — Next.js API route returning a GeoJSON FeatureCollection (162 KB). No auth, no Cloudflare friction. Reproducible with plain Python requests.
  • POOL data source: Public locator scrape at poolcorp.com/map_api/map.php (May 2026), filtered to US only (424 of 476 worldwide entries).
  • Distance metric: Great-circle (haversine) miles, not drive-time. Underestimates friction in mountain/coastal cases but adequate for ranking competitive proximity.
  • Brand mismatch caveat: The API returns 9 brand names while HERITAGE_CONTEXT.md §2 lists ~12 acquired brands. The 12-brand corporate structure is rolled up into the consolidated "HERITAGE POOL SUPPLY" front-end brand in the API. Branch counts are consistent with all acquired brands being included.
  • POOL count reconciliation: 424 US locator entries vs 456 sales centers per 10-K (gap explained in HERITAGE_CONTEXT.md §8 — locator excludes some intl, NPT, and recently-closed/in-transit locations).
  • Files produced this session (all in dashboards/pool_locations/): heritage_locations.csv (163 rows) · heritage_nearest_pool.csv (per-branch nearest pairing) · heritage_overlap_by_state.csv (51-row state table) · heritage_overlap_metrics.json (full numeric summary) · heritage_vs_poolcorp.png (static map) · heritage_locations.html (folium interactive — embedded above) · HERITAGE_OVERLAP.md (7-section findings doc) · plus scrapers in scrape_heritage_xhr.py, build_heritage_overlap.py, build_heritage_map.py, build_heritage_html_map.py